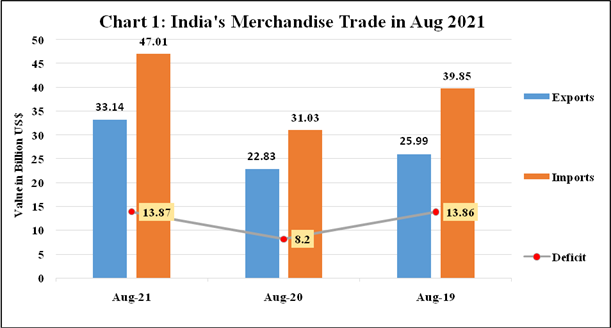
India’s merchandise export in August 2021 was $33 billion, an increase of 45% over $22 billion in August 2020, and an increase of 27.5% over $25 billion in August 2019.
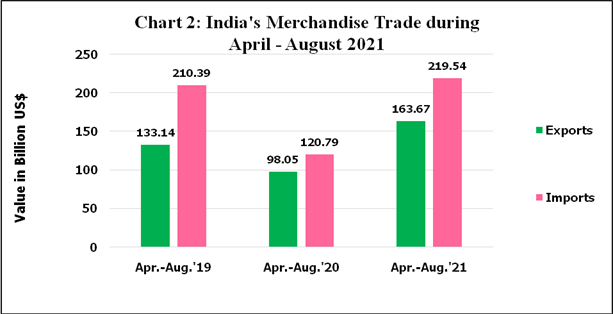
India’s merchandise exports in April-August 2021 was $163.67 billion, an increase of 66.92% over $98.05 billion in April-August 2020 and an increase of 22.93% over $133.14 billion in April-August 2019.
Top 10 major commodity groups, covering more than 80% of total exports, have shown positive growth in August 2021 over corresponding month of previous year.
Exports of Top 10 Major Commodity Groups
| Value of Export (Million$) | Share (%) | Growth (%) | ||
| Major Commodity Group | Aug ‘21 | Aug ‘20 | Aug ‘21 | Aug ’21 Over ‘Aug ‘20 |
| Engineering Goods | 9,631.50 | 6,065.65 | 29.06 | 58.79 |
| Petroleum Products | 4,559.82 | 1,901.64 | 13.76 | 139.78 |
| Gems and Jewelry | 3,428.07 | 1,823.09 | 10.34 | 88.04 |
| Organic and Inorganic Chemicals | 2,230.15 | 1,642.82 | 6.73 | 35.75 |
| Drugs and Pharmaceuticals | 2,001.78 | 1,977.76 | 6.04 | 1.21 |
| Cotton Yarn/Fabrics/Made ups, Handloom Products Etc. | 1,297.82 | 8,33.95 | 3.92 | 55.62 |
| RMG Of All Textiles | 1,235.11 | 1,083.53 | 3.73 | 13.99 |
| Electronic Goods | 1,146.63 | 872.04 | 3.46 | 31.49 |
| Plastic And Linoleum | 753.30 | 648.49 | 2.27 | 16.16 |
| Rice | 715.24 | 671.08 | 2.16 | 6.58 |
| Total of 10 Major Commodity Groups | 26,999.42 | 17,520.05 | 81.47 | 54.11 |
| Rest | 6,141.16 | 5,309.23 | 18.53 | 15.67 |
| Total Exports | 33,140.58 | 22,829.29 | 100.00 | 45.17 |
The trade deficit in August 2021 was $13.87 billion as compared to the trade deficit of $8.2 billion in August 2020, while it was $55.9 billion during April-August 2021 as compared to $22.7 billion during the same period of the previous year.
Last updated: December 26th, 2025

